Value investing means finding stocks that are cheaper than they should be. These investors look at a company’s core values. They search for stocks that are selling for less than they’re really worth.
They use financial metrics to check a company’s value. These metrics help spot stocks that are selling low. This article will cover the best metrics for value investing and how to use them.
Value investors think the market can overreact to news, making stock prices not match a company’s true value. They look for chances where the market prices a stock wrong. This way, they can make money from the difference.
There’s no one “right” way to check a stock, but value investors often use financial metrics. These metrics help find companies that are selling for less than they should.
Key Takeaways
- Value investing focuses on finding stocks trading at a discount to their intrinsic value.
- Financial metrics like the price-to-earnings ratio, price-to-book ratio, and debt-to-equity ratio are commonly used by value investors.
- Analyzing a company’s free cash flow, PEG ratio, and earnings yield can also provide valuable insights for value investors.
- Evaluating a range of valuation metrics can help value investors make informed decisions and uncover potential undervalued opportunities.
- Understanding how to interpret and apply these metrics is crucial for successfully implementing a value investing strategy.
What is Value Investing?
Value investing is a strategy that looks for companies whose stocks are cheaper than they should be. Famous investors like Benjamin Graham and Warren Buffett use this method. They aim to find companies that are not priced correctly in the market.
Also Read : How To Identify And Secure Safe Stocks?
Fundamentals of Value Investing
Value investing is built on a few main ideas:
- Looking for companies that are cheaper than they should be, based on their finances and growth potential
- Thinking about a company’s long-term value, not just its short-term price changes
- Using detailed financial analysis to figure out a company’s real value
- Waiting for the market to catch on to a company’s true value
Key Principles of Value Investing
Value investors use certain rules to guide them:
- Margin of Safety: Investing with a buffer to protect against losses
- Intrinsic Value: Figuring out a company’s real value by looking at its finances and growth potential
- Patience: Keeping investments for the long haul, letting the market value the company correctly
- Discipline: Staying true to a clear investment plan and avoiding decisions based on feelings
By following these value investing principles, investors can create a portfolio of companies that are likely to grow and increase in value over time.
“The best way to measure your investing success is not by whether you’re beating the market but by whether you’ve put in place a financial plan and a behavioral discipline that are likely to get you where you want to go.” – Benjamin Graham
Also Read : How Gay Celebrities Use Their Platforms For Social Change ?
Price-to-Earnings (P/E) Ratio
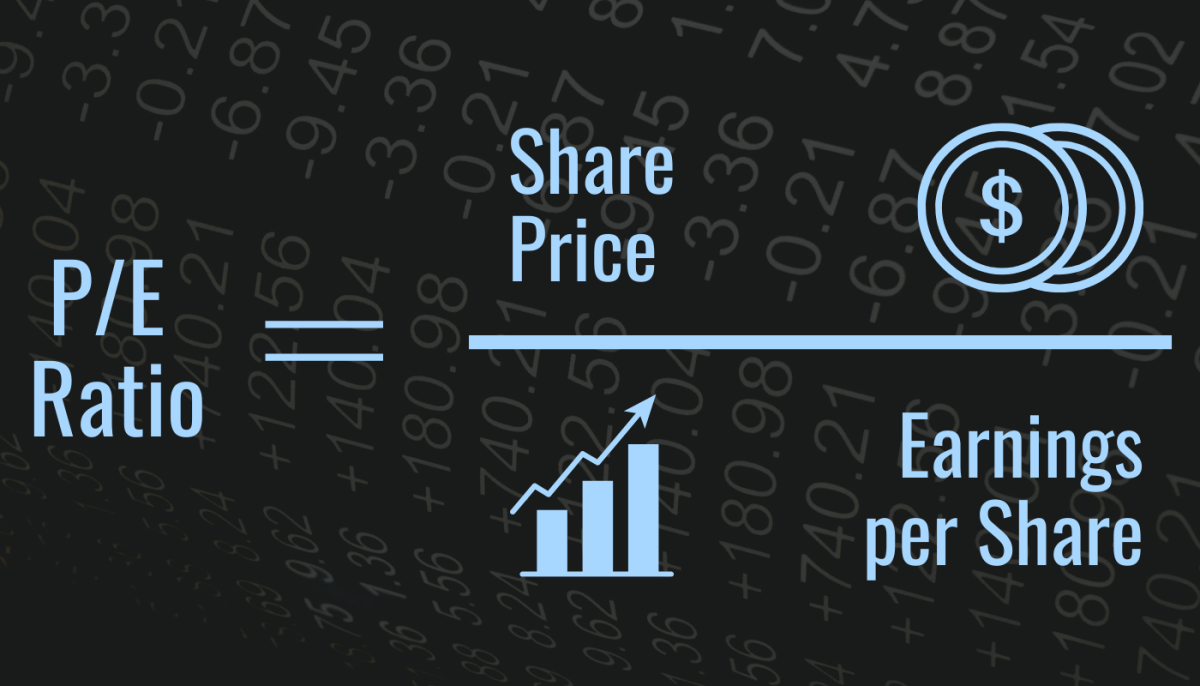
The price-to-earnings (P/E) ratio is key in value investing and stock valuation. It compares a company’s stock price to its earnings per share (EPS). This gives insight into how the market sees the company’s profits. Investors use the P/E ratio to see if a stock is priced too low or too high.
Interpreting the P/E Ratio
A low P/E ratio, usually under 15, might mean a stock is priced too low. This could be a chance to invest at a good price. On the other hand, a high P/E ratio, often over 20, could mean the stock is too expensive. The P/E ratio helps investors spot good deals and decide on a fair stock price.
Limitations of the P/E Ratio
The P/E ratio is useful but has its limits. It doesn’t consider a company’s growth potential, which can affect its earnings and stock price. Also, the ratio can be swayed by a company’s past earnings or future estimates, which might not truly reflect its value. So, investors should use the P/E ratio with other analysis methods for better investment choices.
| P/E Ratio Range | Interpretation |
|---|---|
| Below 15 | Potentially undervalued stock |
| 15 to 20 | Fairly valued stock |
| Above 20 | Potentially overvalued stock |
“The P/E ratio is a powerful tool for value investors, but it should be used in conjunction with other fundamental analysis techniques to get a complete picture of a company’s intrinsic value.”
Also Read : Empowering Female Celebrities Who Inspire Us
Price-to-Book (P/B) Ratio

In the stock market, the price-to-book ratio, or P/B ratio, is key for investors. It compares a company’s market value to its book value. This shows if a stock is priced too low or too high.
To find the P/B ratio, divide the company’s share price by its book value per share (BVPS). The book value is the company’s net worth, found by subtracting liabilities from assets. This ratio tells investors if a stock is selling at a discount or a premium.
A P/B ratio under 1 means the stock is likely undervalued, since its market price is less than its net worth. On the other hand, a ratio over 1 suggests the stock is overvalued, with its market price higher than its book value. Investors looking for value often focus on companies with a low P/B ratio. This suggests the market might not fully recognize the company’s true worth.
| P/B Ratio | Interpretation |
|---|---|
| Less than 1 | Potentially undervalued |
| Equal to 1 | Trading at book value |
| Greater than 1 | Potentially overvalued |
Remember, the P/B ratio should be looked at with other financial metrics and industry factors for a full investment view. A low P/B ratio might mean a good deal, but check the company’s financial health, growth potential, and its place in the industry too.
“The price-to-book ratio is a valuable tool for identifying potentially undervalued stocks, but it should be used in conjunction with other financial analysis to get a complete picture of a company’s worth.”
Also Read : Best Stocks For Long-Term Investment Success
Debt-to-Equity Ratio
In value investing, the debt-to-equity (D/E) ratio is key. It shows how a company uses debt and equity to fund its assets. Knowing a firm’s D/E ratio helps understand its financial risk and leverage.
Deciphering Debt-to-Equity Ratios
To find the debt-to-equity ratio, divide a company’s total liabilities by its total shareholders’ equity. A low ratio, below 1, means the company uses more equity than debt. A high ratio, above 2, shows it depends a lot on debt.
What’s the best D/E ratio varies by industry. Real estate and utilities often have higher ratios because of their business needs. Value investors look at a company’s ratio compared to others in its field. This helps them see how it stands on financial leverage and risk.
A high debt-to-equity ratio can have both good and bad sides. It might mean the company is growing fast, but it also takes on more risk. If it can’t make enough money to pay its debts, it’s in trouble. Value investors check how well a company handles its debt and cash flow to avoid these risks.
“A low debt-to-equity ratio suggests a company is conservatively financed and less vulnerable to economic downturns, while a high ratio may indicate increased risk and financial instability.”
Looking at the debt-to-equity ratio with other financial info helps value investors understand a company’s financial health. This is key to figuring out a stock’s true value and investment potential.
Also Read : Trending Beauties: Top 5 Hot Female Celebrities
Free Cash Flow (FCF)

In the world of value investing, free cash flow (FCF) is key. It’s the cash a company makes from its work, minus what it spends on new equipment. This tells us a lot about a company’s health and its ability to pay out to shareholders.
Importance of Free Cash Flow
Free cash flow shows how well a company runs and its growth potential. It’s better than earnings because it’s not swayed by accounting tricks. A company with lots of free cash can invest more, pay dividends, or buy back shares. All these actions can increase shareholder value.
For those into value investing, looking at a company’s free cash flow is smart. It often comes before earnings go up. So, if a company’s free cash is rising, its earnings might get better soon.
“Free cash flow is the cash that a company is able to generate after laying out the money required to maintain or expand its asset base. It’s a measure of a company’s financial performance and health.”
Knowing about free cash flow helps value investors make better choices. They can spot companies likely to do well over time.
PEG Ratio (Price/Earnings-to-Growth)

The PEG ratio is a key tool for investors looking at stock values. It mixes the price-to-earnings (P/E) ratio with earnings growth. This gives a full picture of if a stock is priced right or not.
To find the PEG ratio, divide the P/E ratio by the expected earnings growth rate. For instance, a stock with a P/E of 15 and 10% growth rate has a PEG of 1.5 (15 / 10).
A PEG under 1 means the stock is likely undervalued, priced too low for its growth. A PEG over 1 suggests it’s overvalued, priced too high for its growth.
The PEG ratio is key for value investing. It looks at both current price and future growth. This helps investors find undervalued stocks with big earnings growth potential.
“The PEG ratio is a useful tool for value investors seeking to identify stocks that are trading at a discount to their intrinsic worth.” – Warren Buffett, renowned value investor
When using the PEG ratio, think about the industry, market, and the company’s position and growth outlook. A low PEG doesn’t always mean a stock is a good buy. Look at the debt-to-equity ratio and free cash flow too for a full stock valuation check.
Value Investing

Value investing is a strategy that has worked well for many investors over the years. It’s all about finding undervalued stocks – companies whose price is lower than their true worth. This is done by deeply analyzing a company’s finances, management, and its place in the market.
Value investors think the market sometimes gets it wrong, making some stocks cheaper than they should be. They look for these undervalued stocks to make money from the market’s mistakes. This way, they hope to earn long-term returns that beat the average market.
The main ideas of value investing are:
- Looking at a company’s core values, not just its daily ups and downs
- Choosing stocks with low P/E or P/B ratios
- Keeping an eye on the long game, holding stocks for years
- Spreading investments across different areas to reduce risk
By following these rules, value investors try to create a mix of undervalued stocks that will do well over time. This method might not always lead in the short term. But, focusing on fundamentally strong companies at good prices has been a winning investment strategy for many.
Earnings Yield
When looking at stock valuation, the earnings yield is key for smart investors. It shows a company’s real value and helps with making investment choices.
The earnings yield is the opposite of the price-to-earnings (P/E) ratio. You get it by dividing earnings per share by the stock price. This tells you how much a company makes for every dollar you invest. It’s vital for understanding stock valuation and your risk tolerance.
Calculating and Interpreting Earnings Yield
To find the earnings yield, just divide the company’s earnings per share by its stock price. For instance, if a company makes $2 per share and its stock is at $40, its earnings yield is 5% (2/40 = 0.05 or 5%).
A higher earnings yield means a stock could be a better investment. People often seek stocks with yields over 5%. These may offer more safety than lower-yielding options or fixed-income investments.
- Earnings yield = Earnings per share / Stock price
- A higher earnings yield suggests a stock might be underpriced
- Investors might choose stocks with yields above 5% based on their risk tolerance
Knowing about the earnings yield and its link to the E/P ratio helps investors make smarter investment decisions. It lets them see the real worth of possible investments.
EV/EBITDA Ratio
In the investment world, the EV/EBITDA ratio is key. It shows a company’s true value by combining its enterprise value with its earnings before interest, taxes, depreciation, and amortization (EBITDA). This gives a full picture of a company’s financial health and growth potential.
To find the EV/EBITDA ratio, add the company’s debt and stock value, then subtract its cash. This total is the enterprise value. Divide this by the EBITDA to get the ratio. This shows how much an investor pays for the company’s cash flow.
A lower EV/EBITDA ratio than the S&P 500’s median of 13.3 over the past 10 years means the stock might be a good deal. It means the company makes more cash flow for its value. This makes it a great choice for investors looking for value.
| Metric | Description | Interpretation |
|---|---|---|
| EV/EBITDA Ratio | Measures a company’s enterprise value relative to its EBITDA | Lower ratios may indicate an undervalued stock, while higher ratios may suggest the stock is overvalued |
Looking at the EV/EBITDA ratio helps investors understand a company’s valuation metrics better. It’s a key part of investment analysis. When used with other financial data, it shows a company’s financial health and growth chances. This helps investors spot good investment chances.
Also Read : How To Build A Strong Investment Portfolio?
Conclusion
Value investing is a strong way to find stocks that are cheaper than they should be. It uses financial metrics and ratios to spot these opportunities. Tools like the price-to-earnings (P/E) ratio and debt-to-equity ratio show how healthy a company is and its future earnings potential.
Success in value investing comes from understanding a company’s basics. By looking at free cash flow, the PEG ratio, and EV/EBITDA ratio, investors get a full picture of a stock’s value. This method, based on deep analysis, helps investors find the best stocks for long-term gains.
Value investing is all about being patient, disciplined, and spotting companies that others miss. This strategy can lead to finding hidden gems and strong returns. It proves that value investing is a reliable way to pick stocks and manage a portfolio over time.
FAQs
Q: What is value investing?
A: Value investing is an investment approach where investors look for stocks that are trading at a price below their intrinsic value, based on various metrics and analysis.
Q: Who are some famous value investors?
A: Some famous value investors include Benjamin Graham, known as the father of value investing, and Warren Buffett, who is also a prominent value investor.
Q: What are some common value investing metrics?
A: Common value investing metrics include price-to-earnings ratio (P/E), price-to-book ratio (P/B), dividend yield, and earnings growth rate.
Q: How do you find value stocks?
A: Value stocks can be found by conducting fundamental analysis to identify companies trading below their intrinsic value, often using metrics like P/E ratio and P/B ratio.
Q: What is the margin of safety in value investing?
A: The margin of safety is a principle in value investing that suggests buying stocks at a significant discount to their intrinsic value, minimizing the risk of loss.
Q: What is the difference between growth stocks and value stocks?
A: Growth stocks are companies expected to have high growth rates, while value stocks are considered undervalued based on fundamental analysis and trade at a discount to their intrinsic value.
Q: How can I learn more about value investing principles?
A: One way to learn more about value investing principles is to study the works of Benjamin Graham and David Dodd, who laid the foundation for value investing in their book “Security Analysis.”
Q: What is security analysis in value investing?
A: Security analysis involves evaluating various financial metrics and qualitative factors to determine the intrinsic value of a security, helping investors make informed investment decisions.


